Data Visualisation
01/05/2024
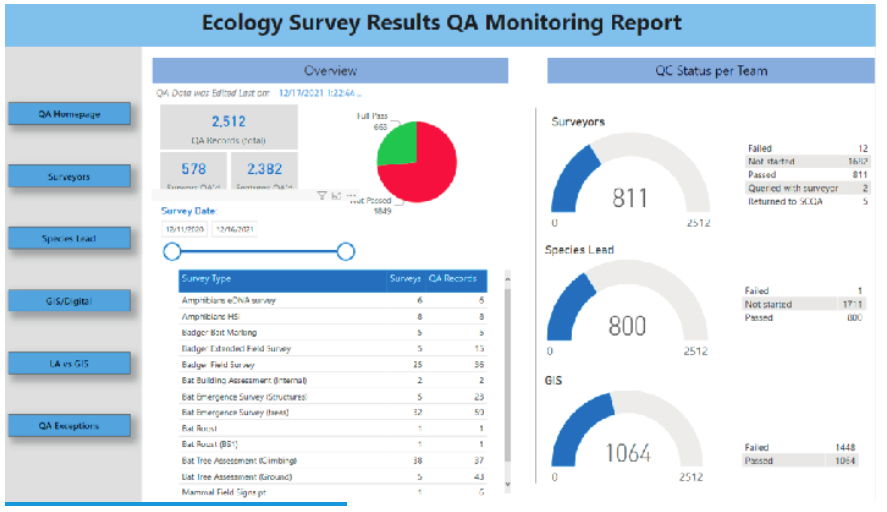
Ecology Survey Monitoring Dashboard for High Speed Rail 2 (Microsoft Power BI):
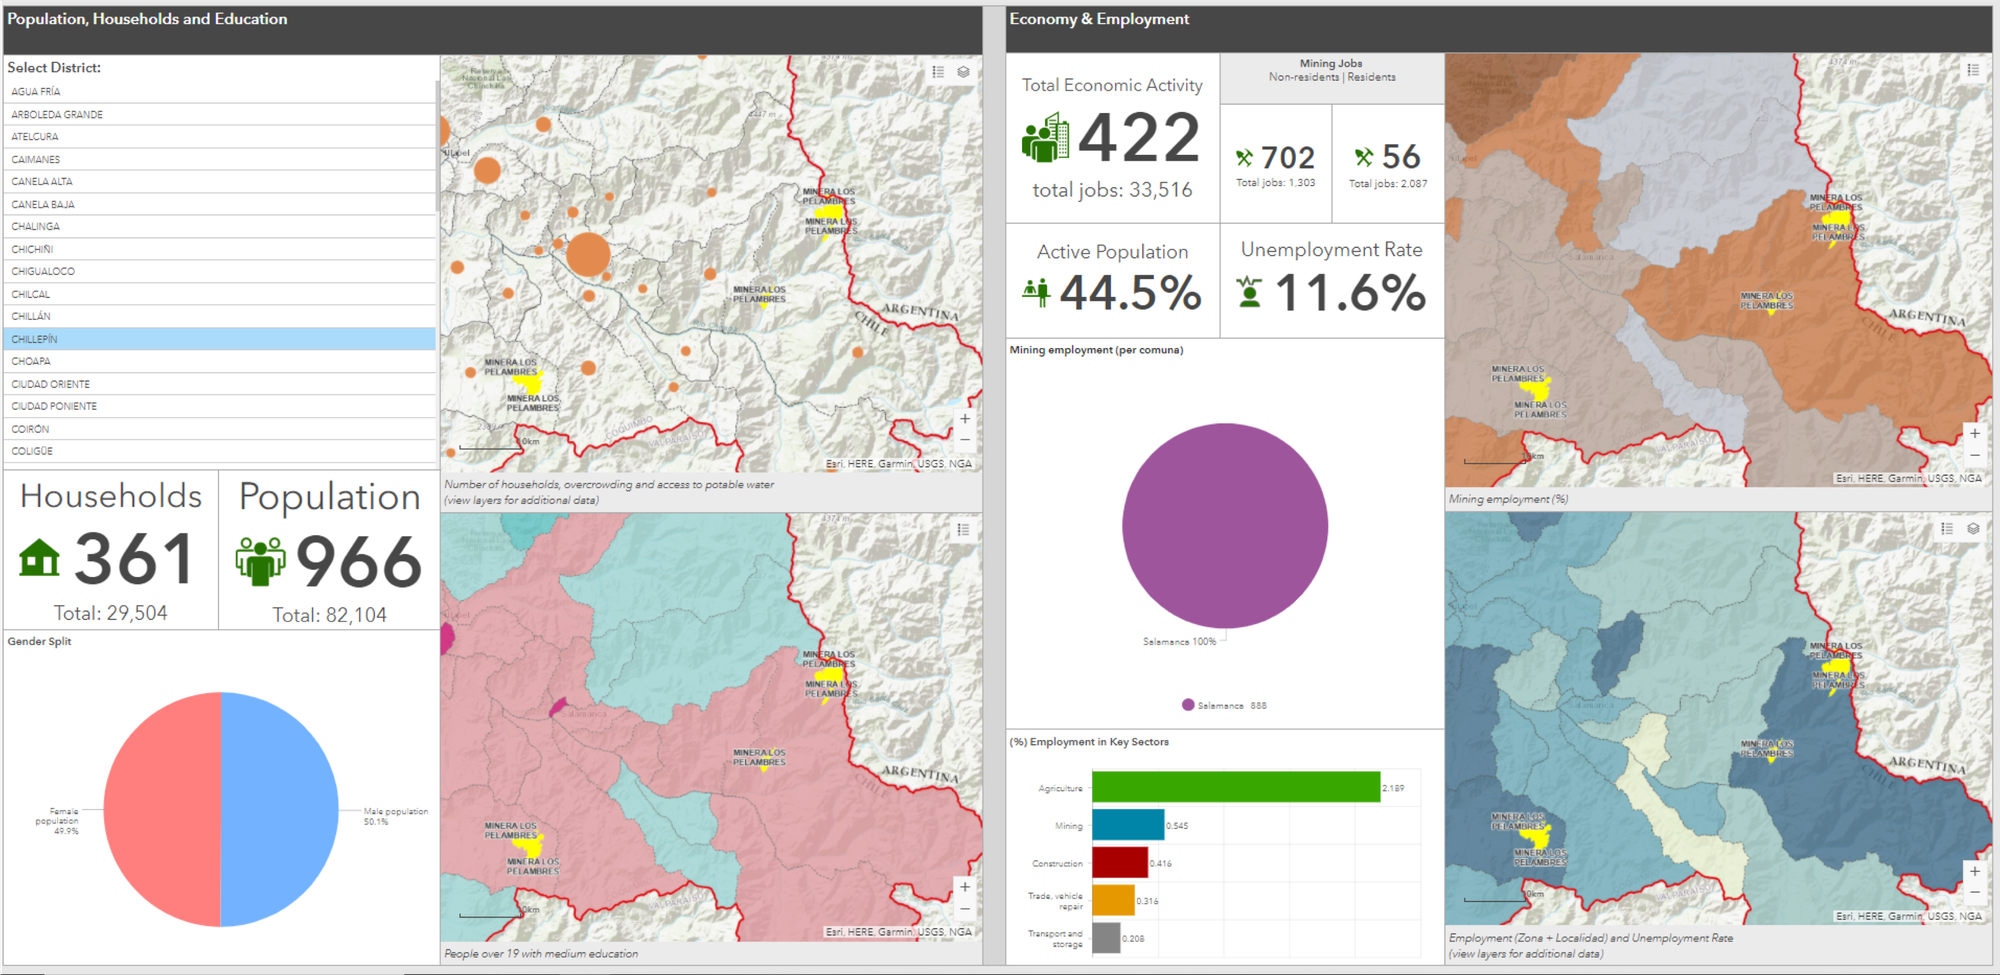
Socio-Economic Profiles for Chile at a municipality-level (Esri Dashboard):
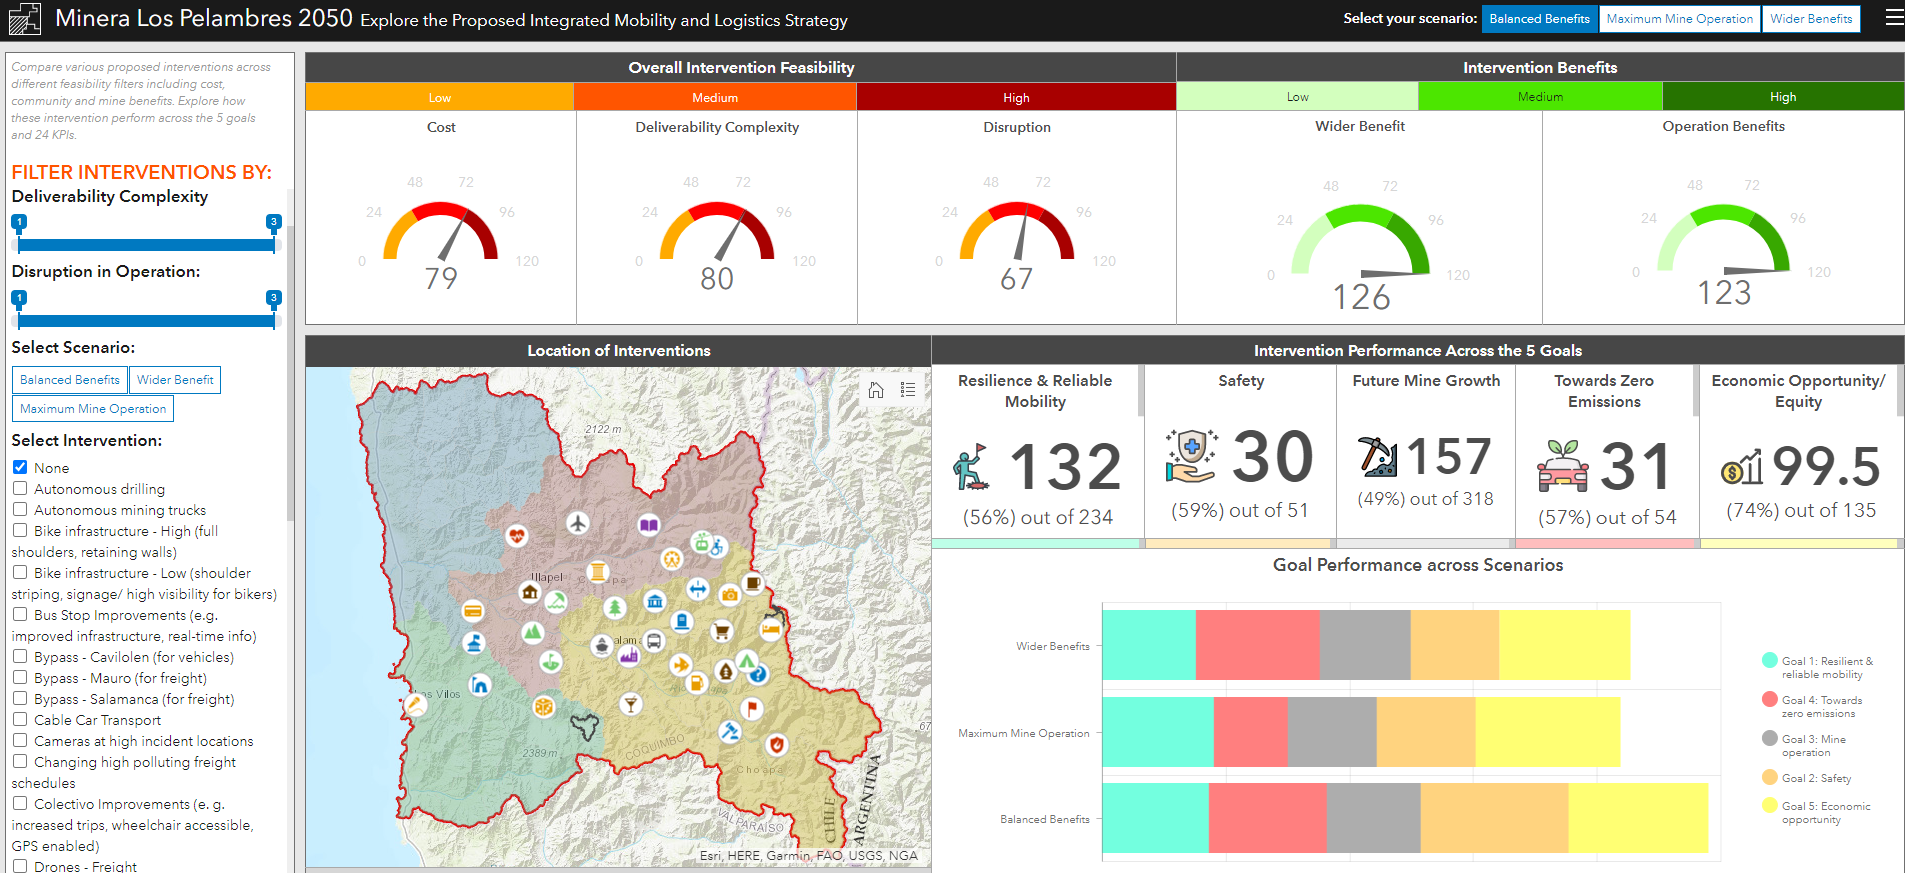
Proposed Logistics & Mobility Interventions for Development:
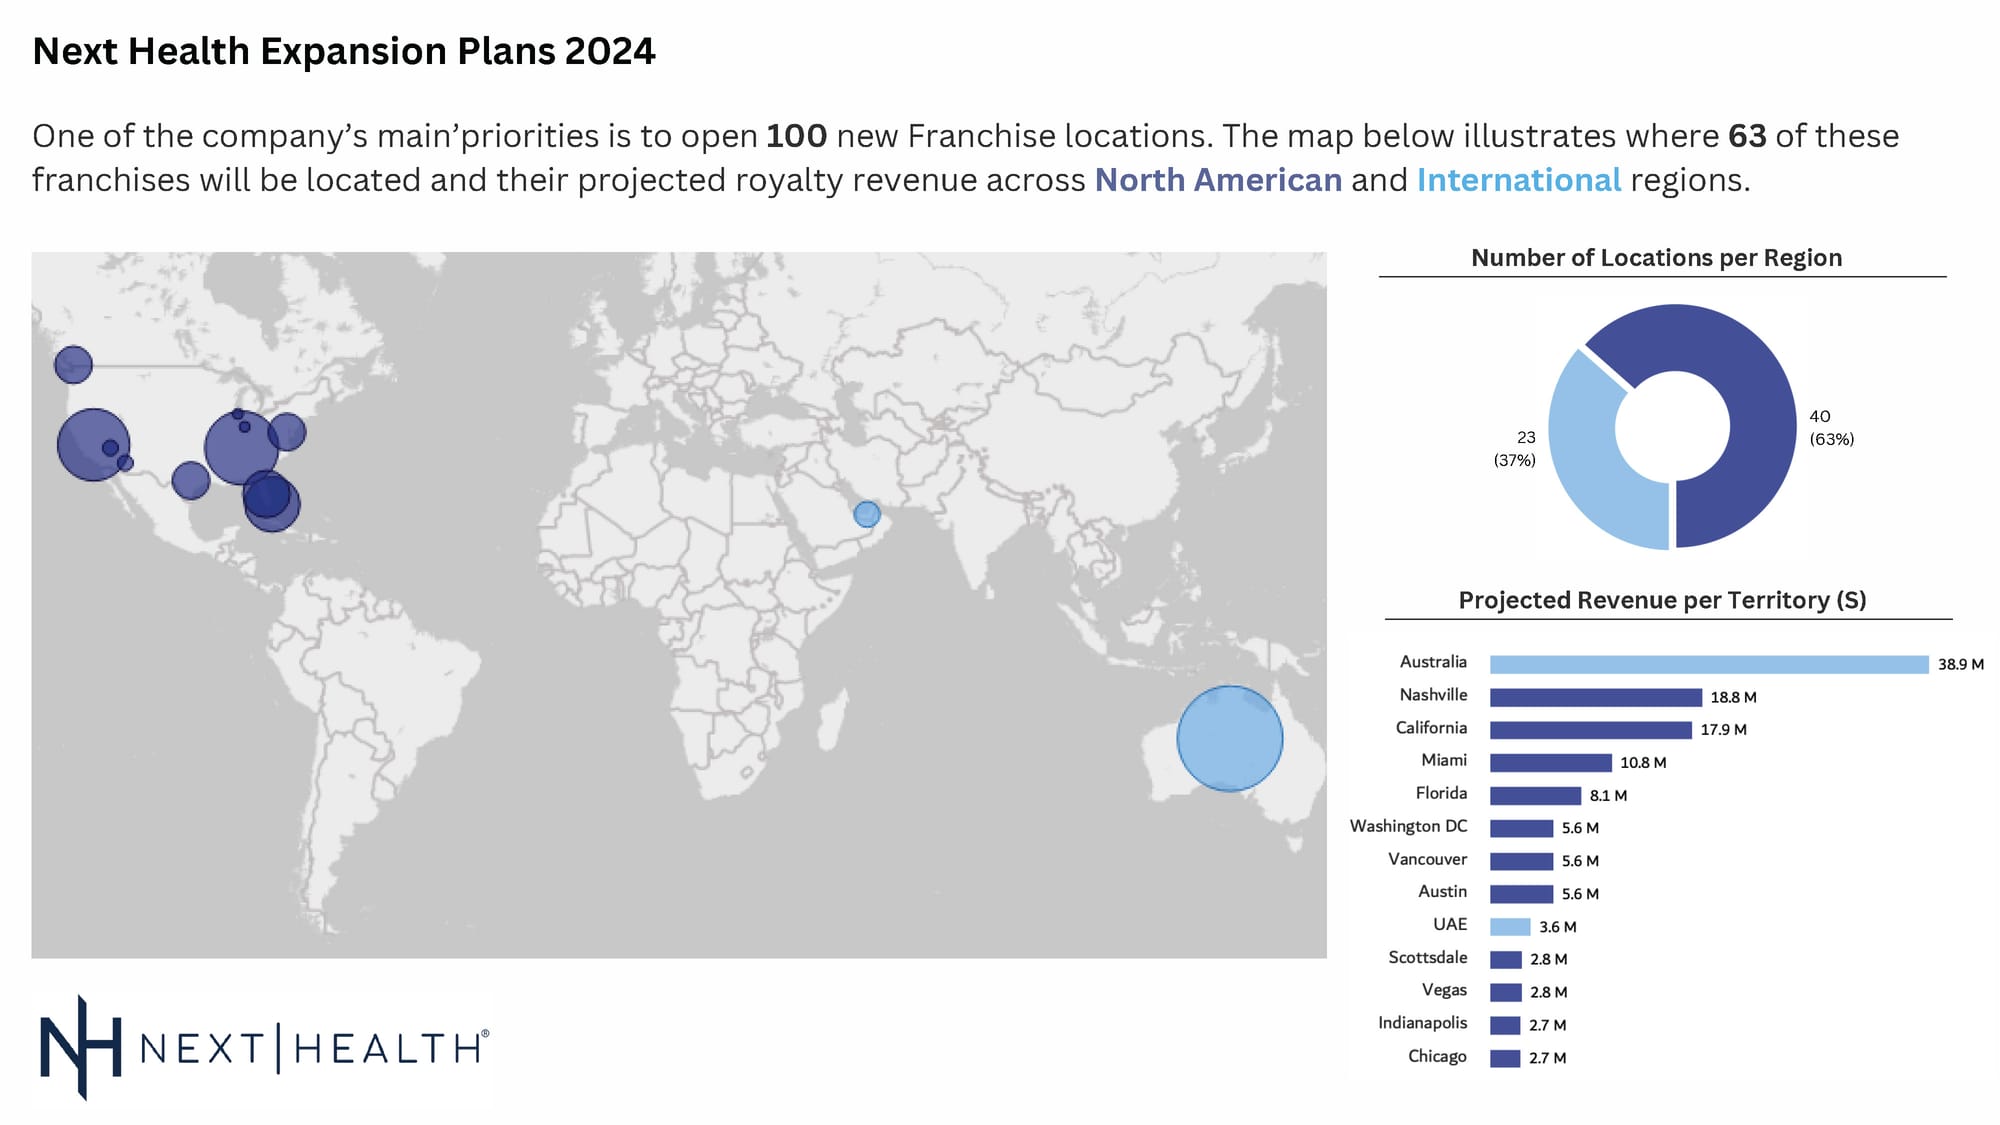
Inforgraphic on the forecasted growth of a healthcare organization (Power BI and Canva):
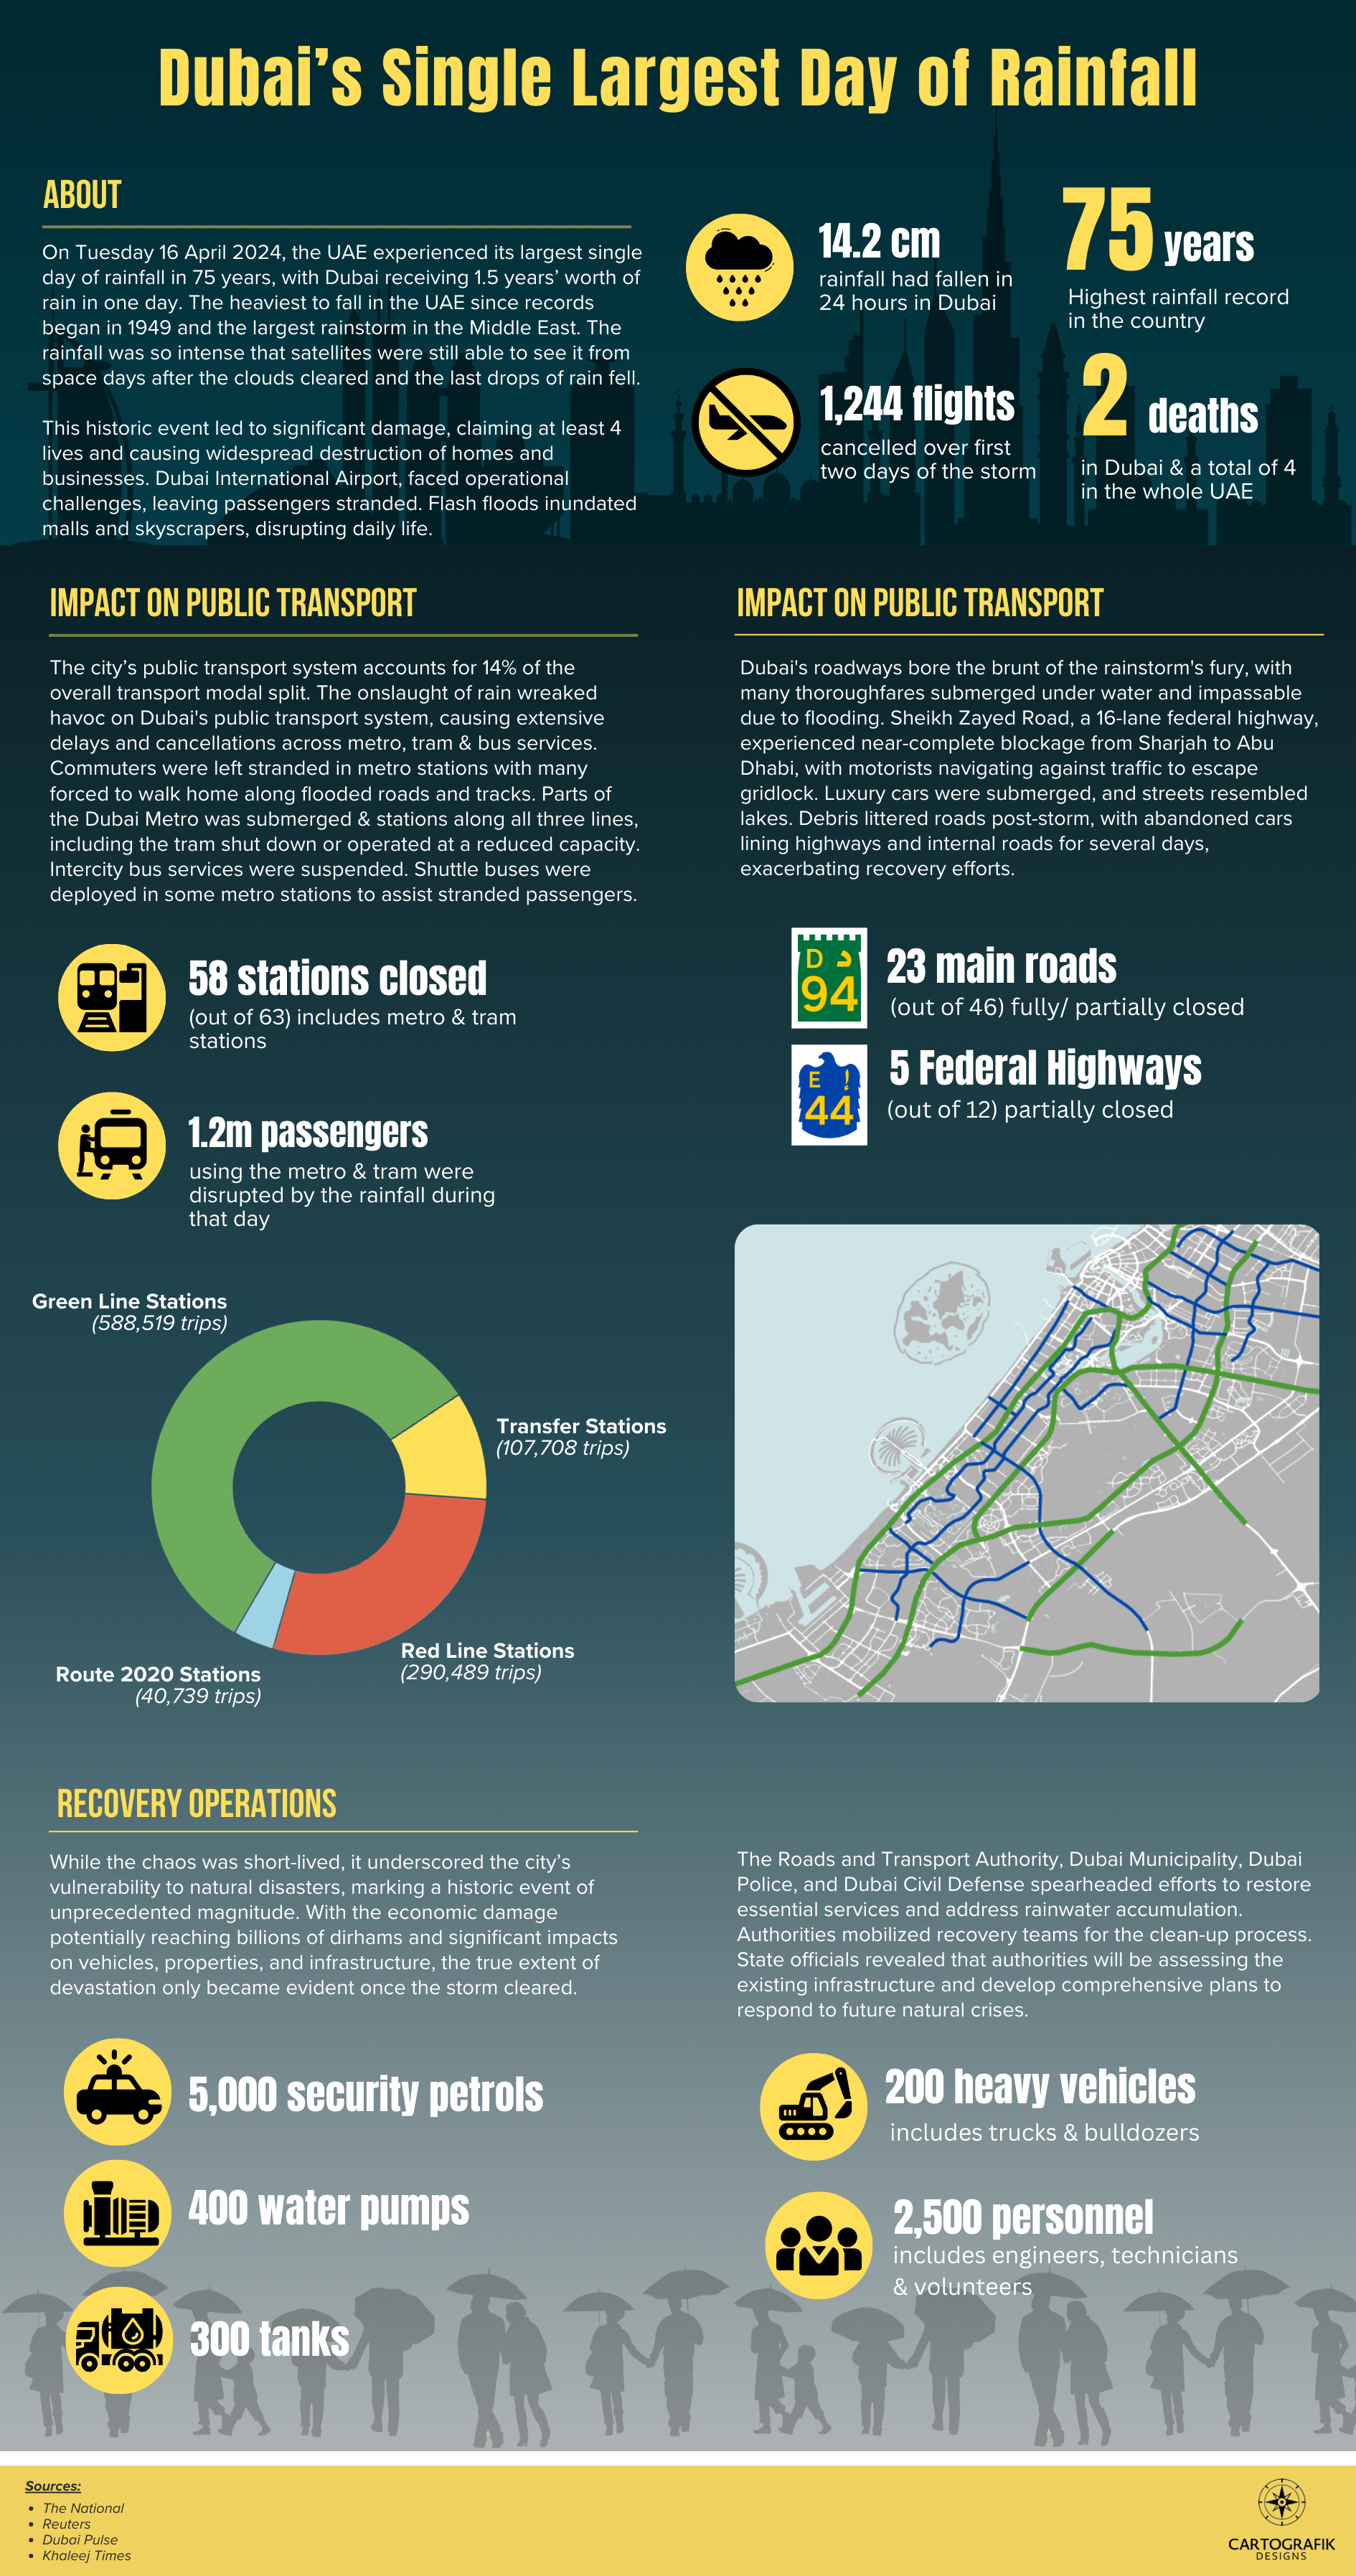
Infographic about the impact of a rainstorm in the city of Dubai (Adobe Illustrator & InDesign):
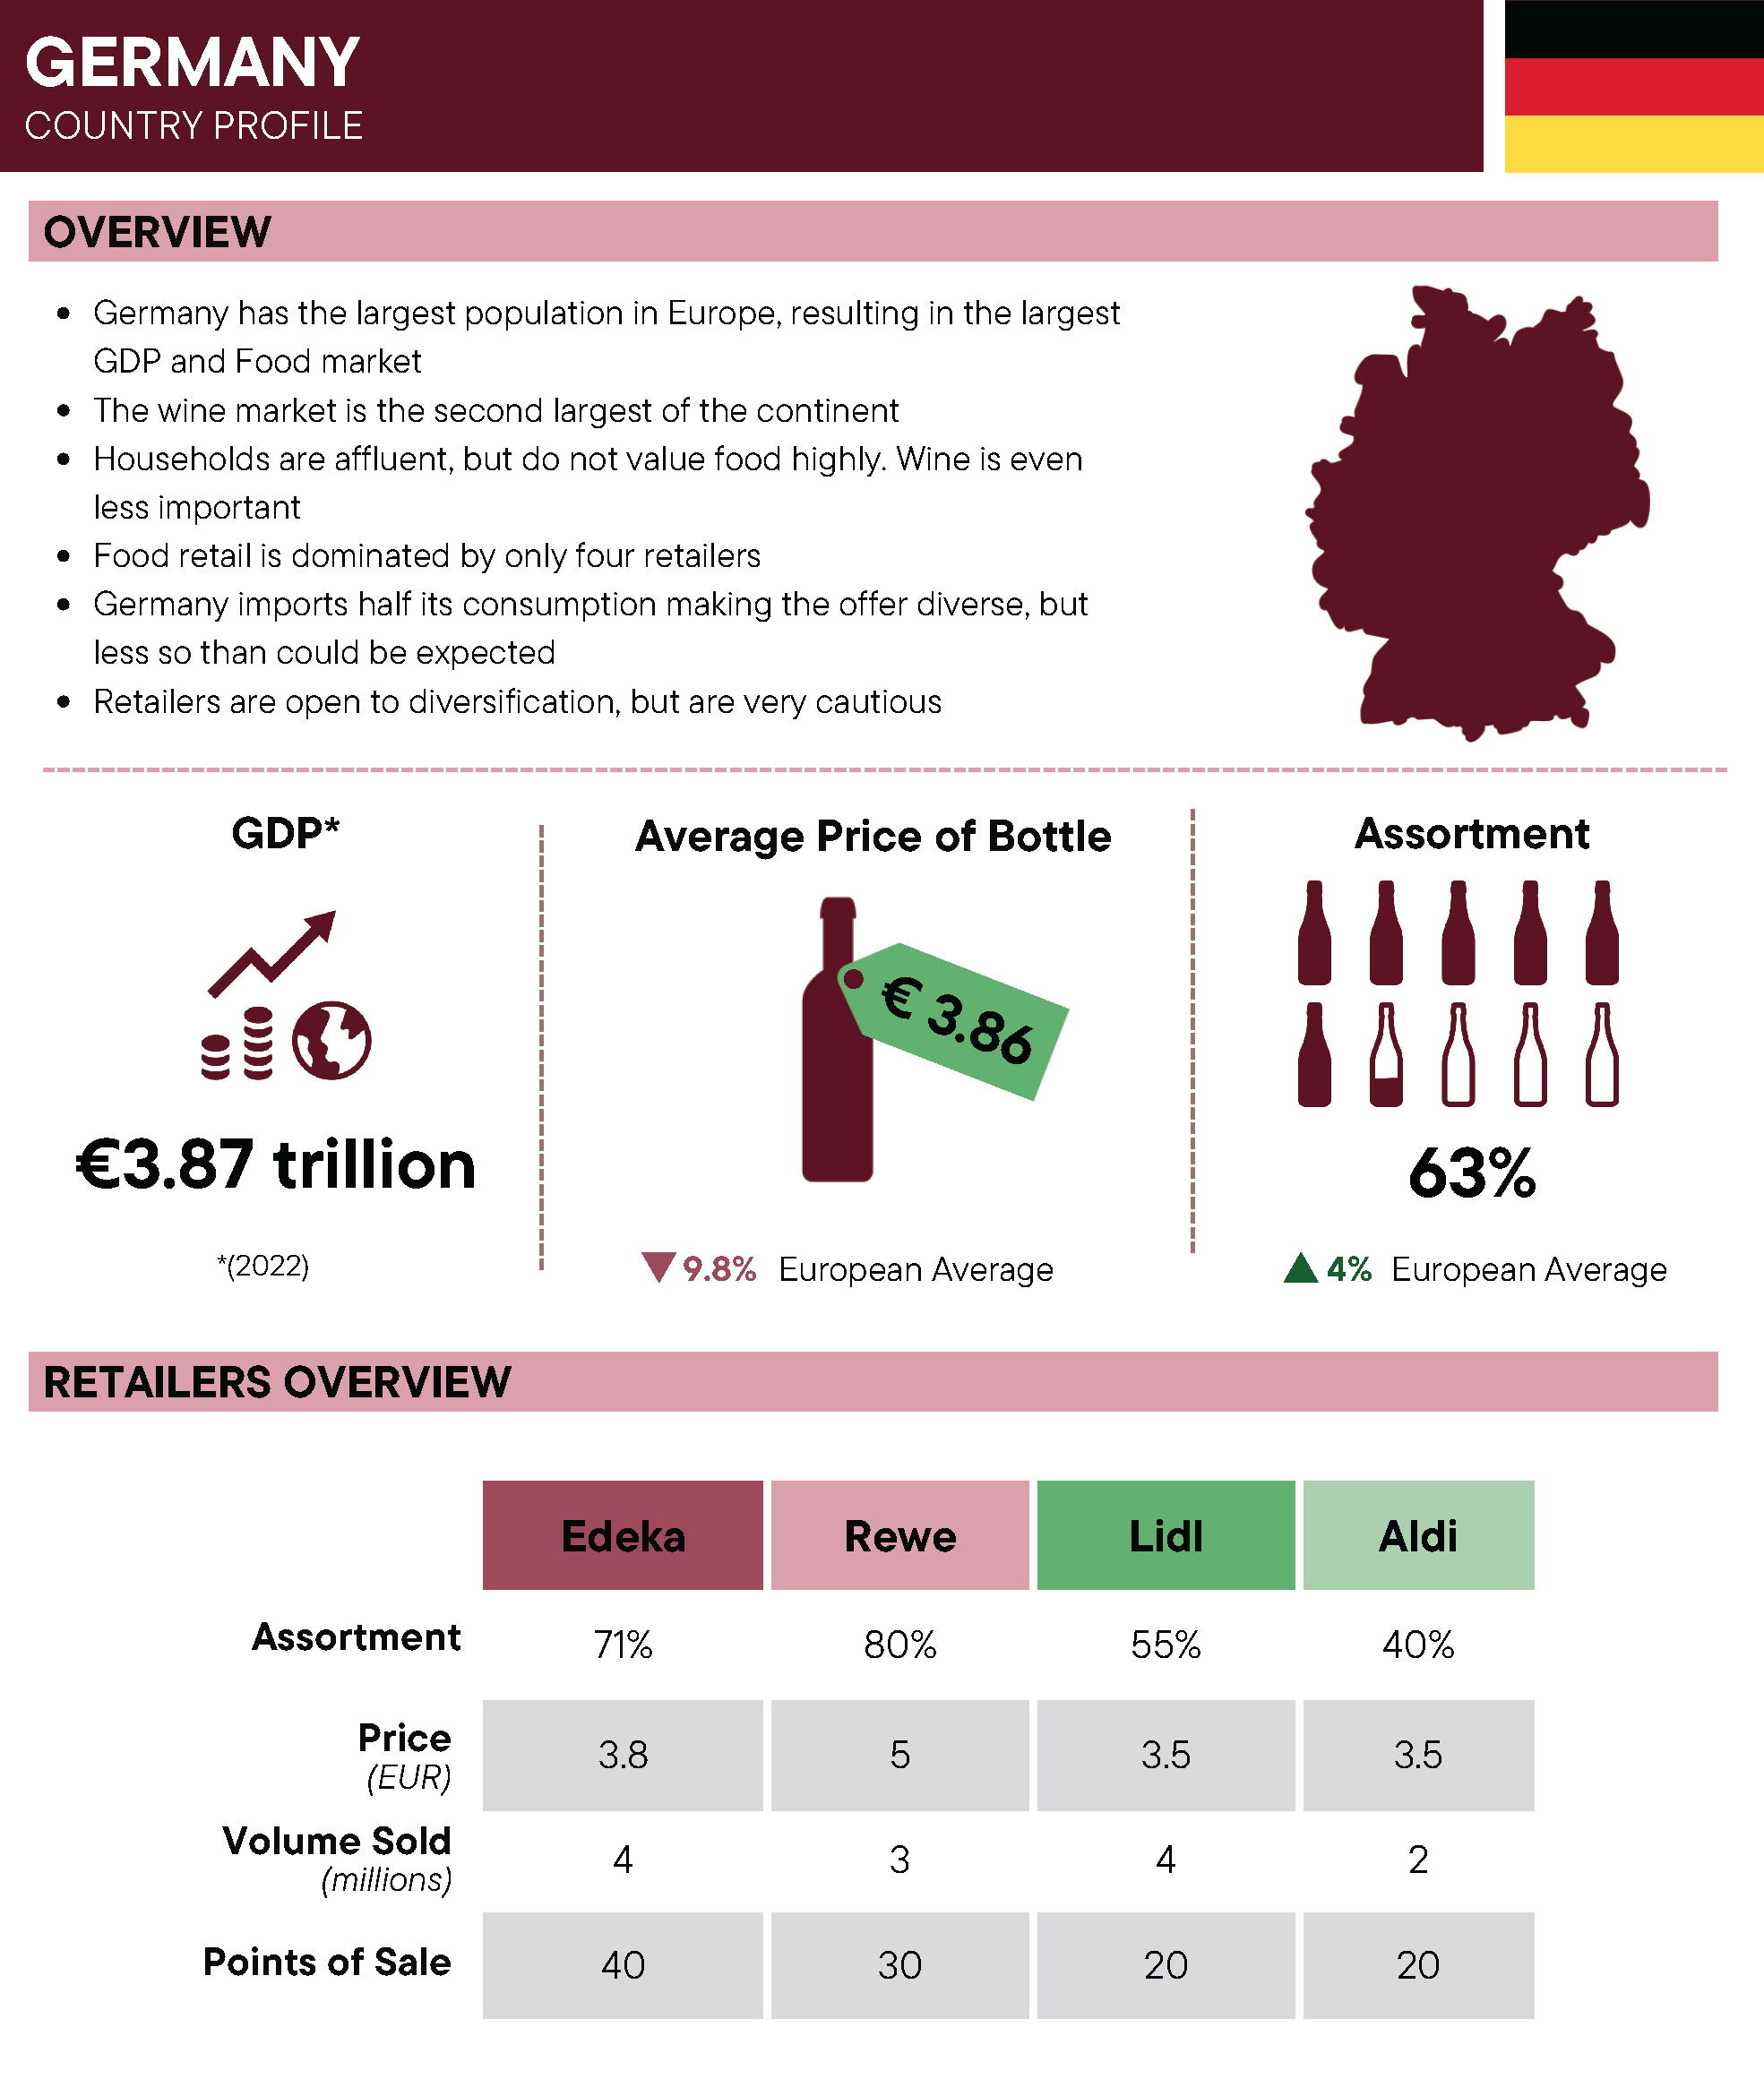
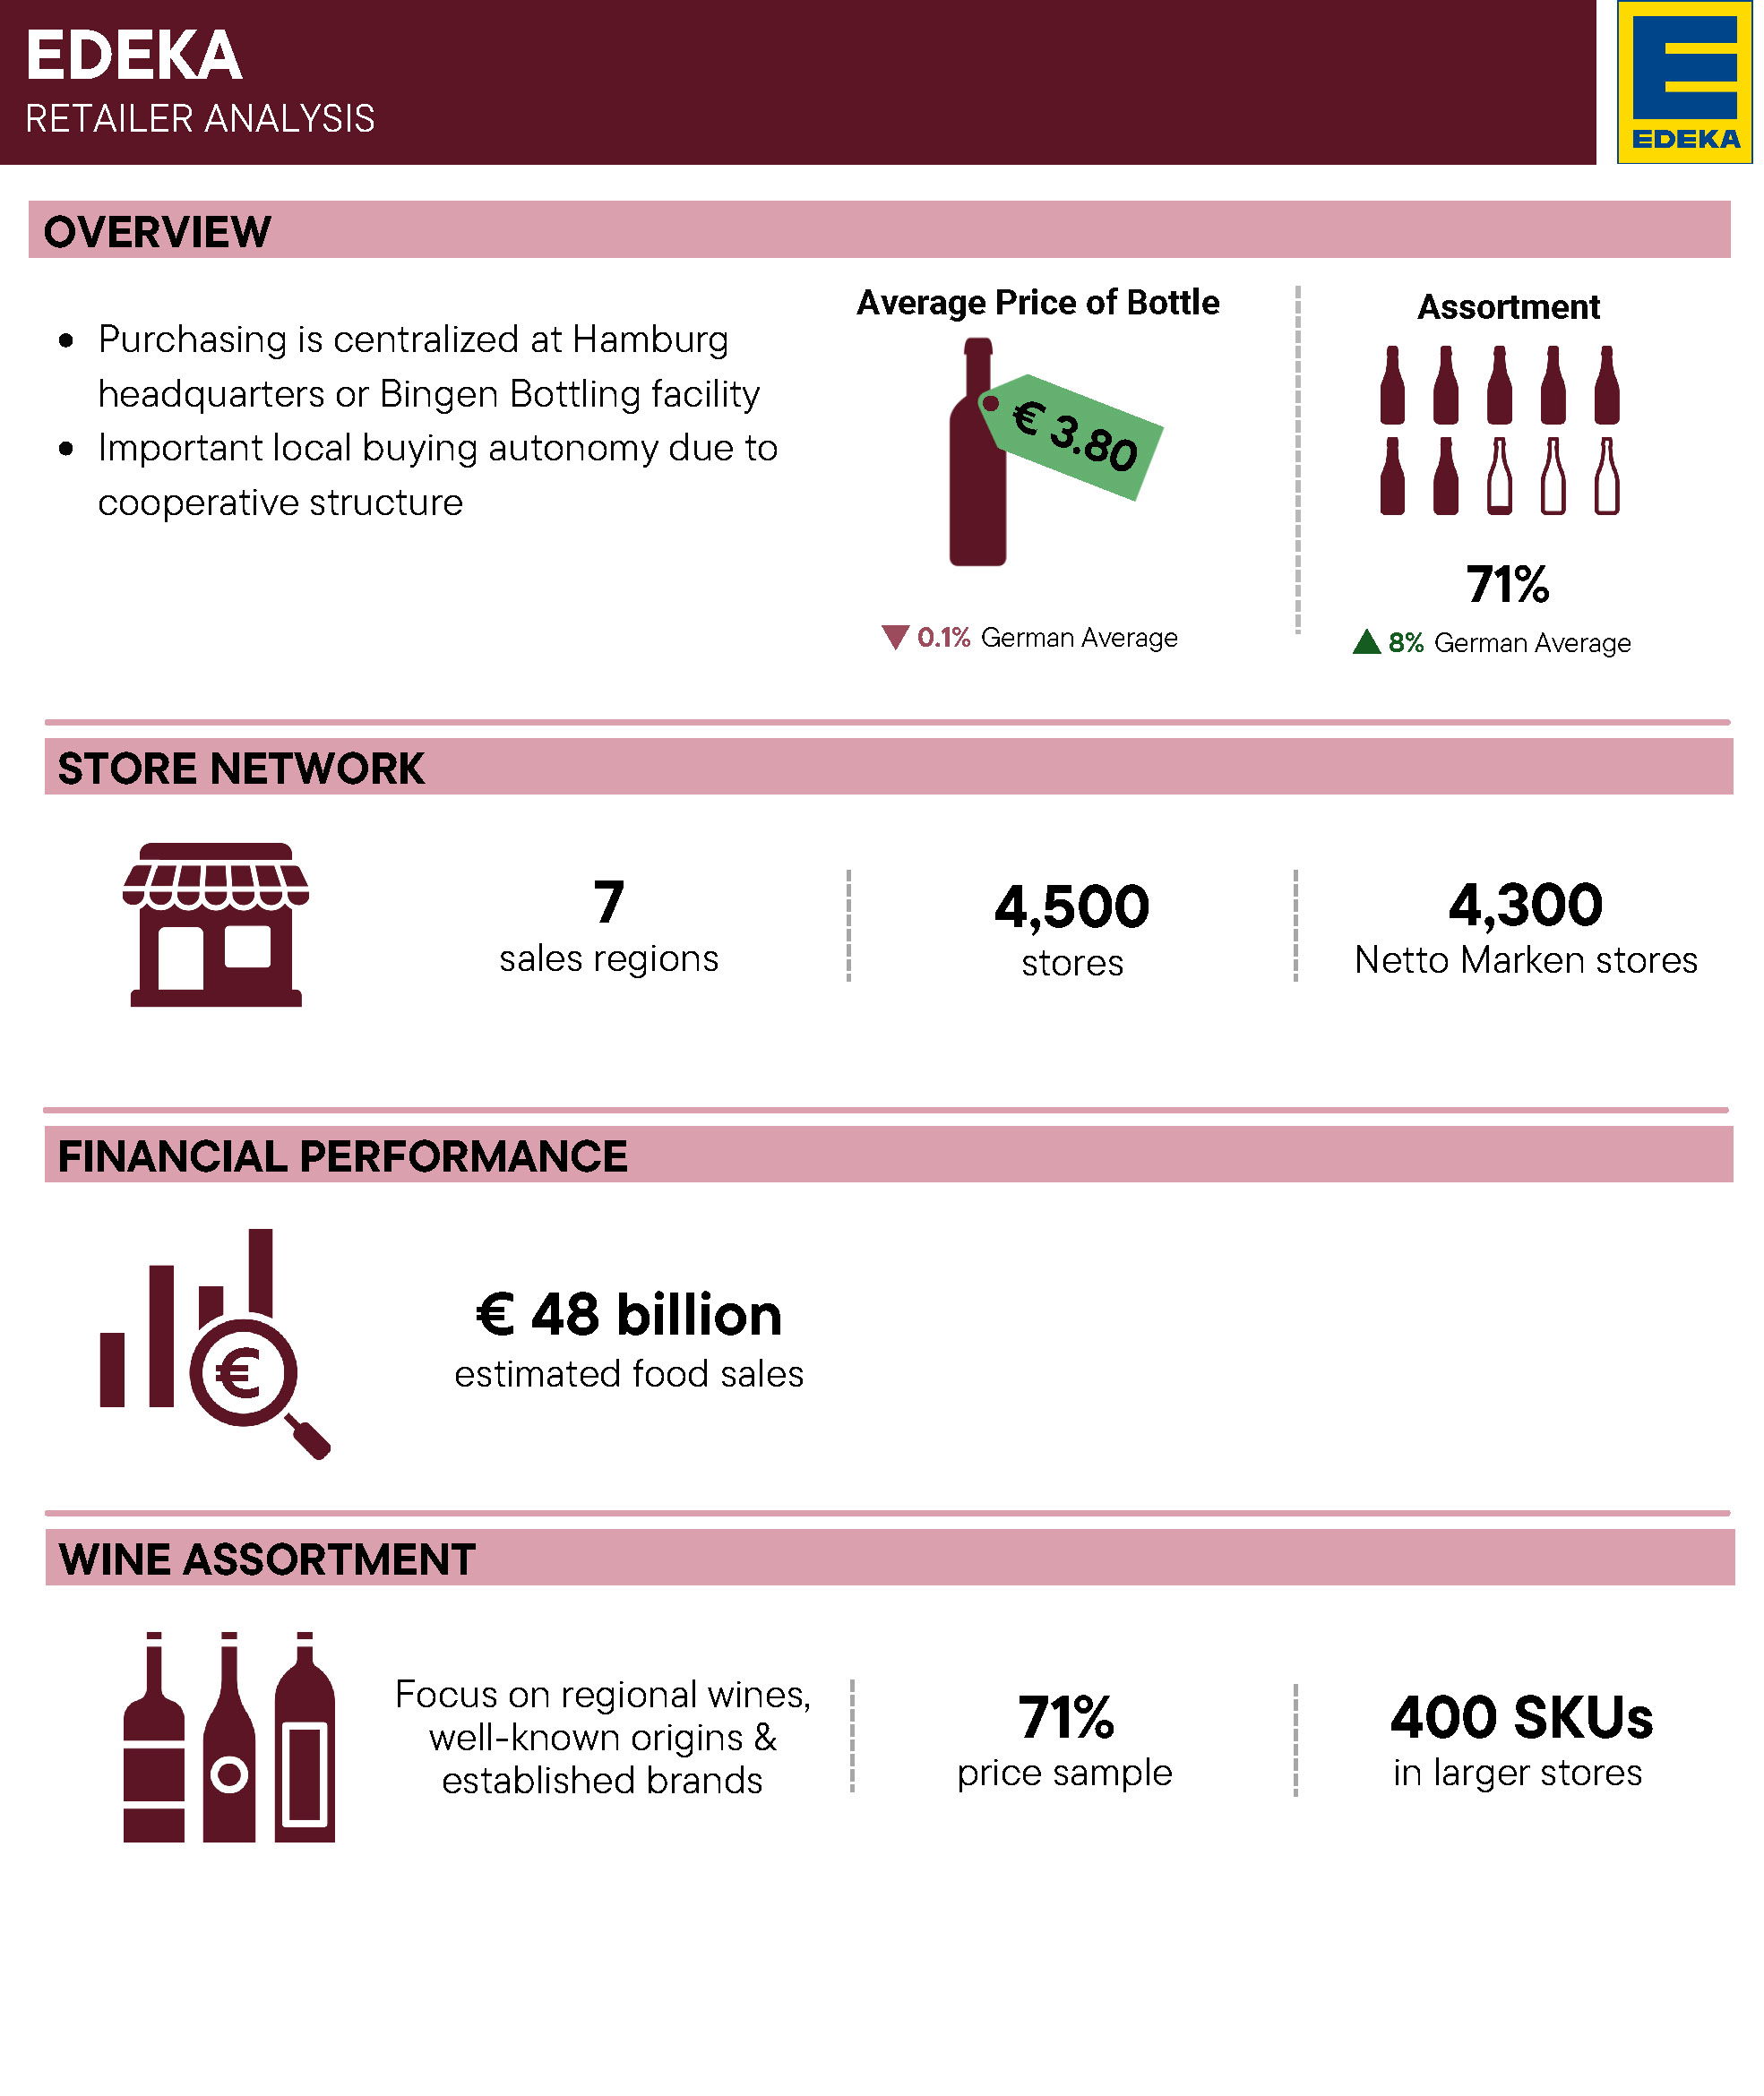
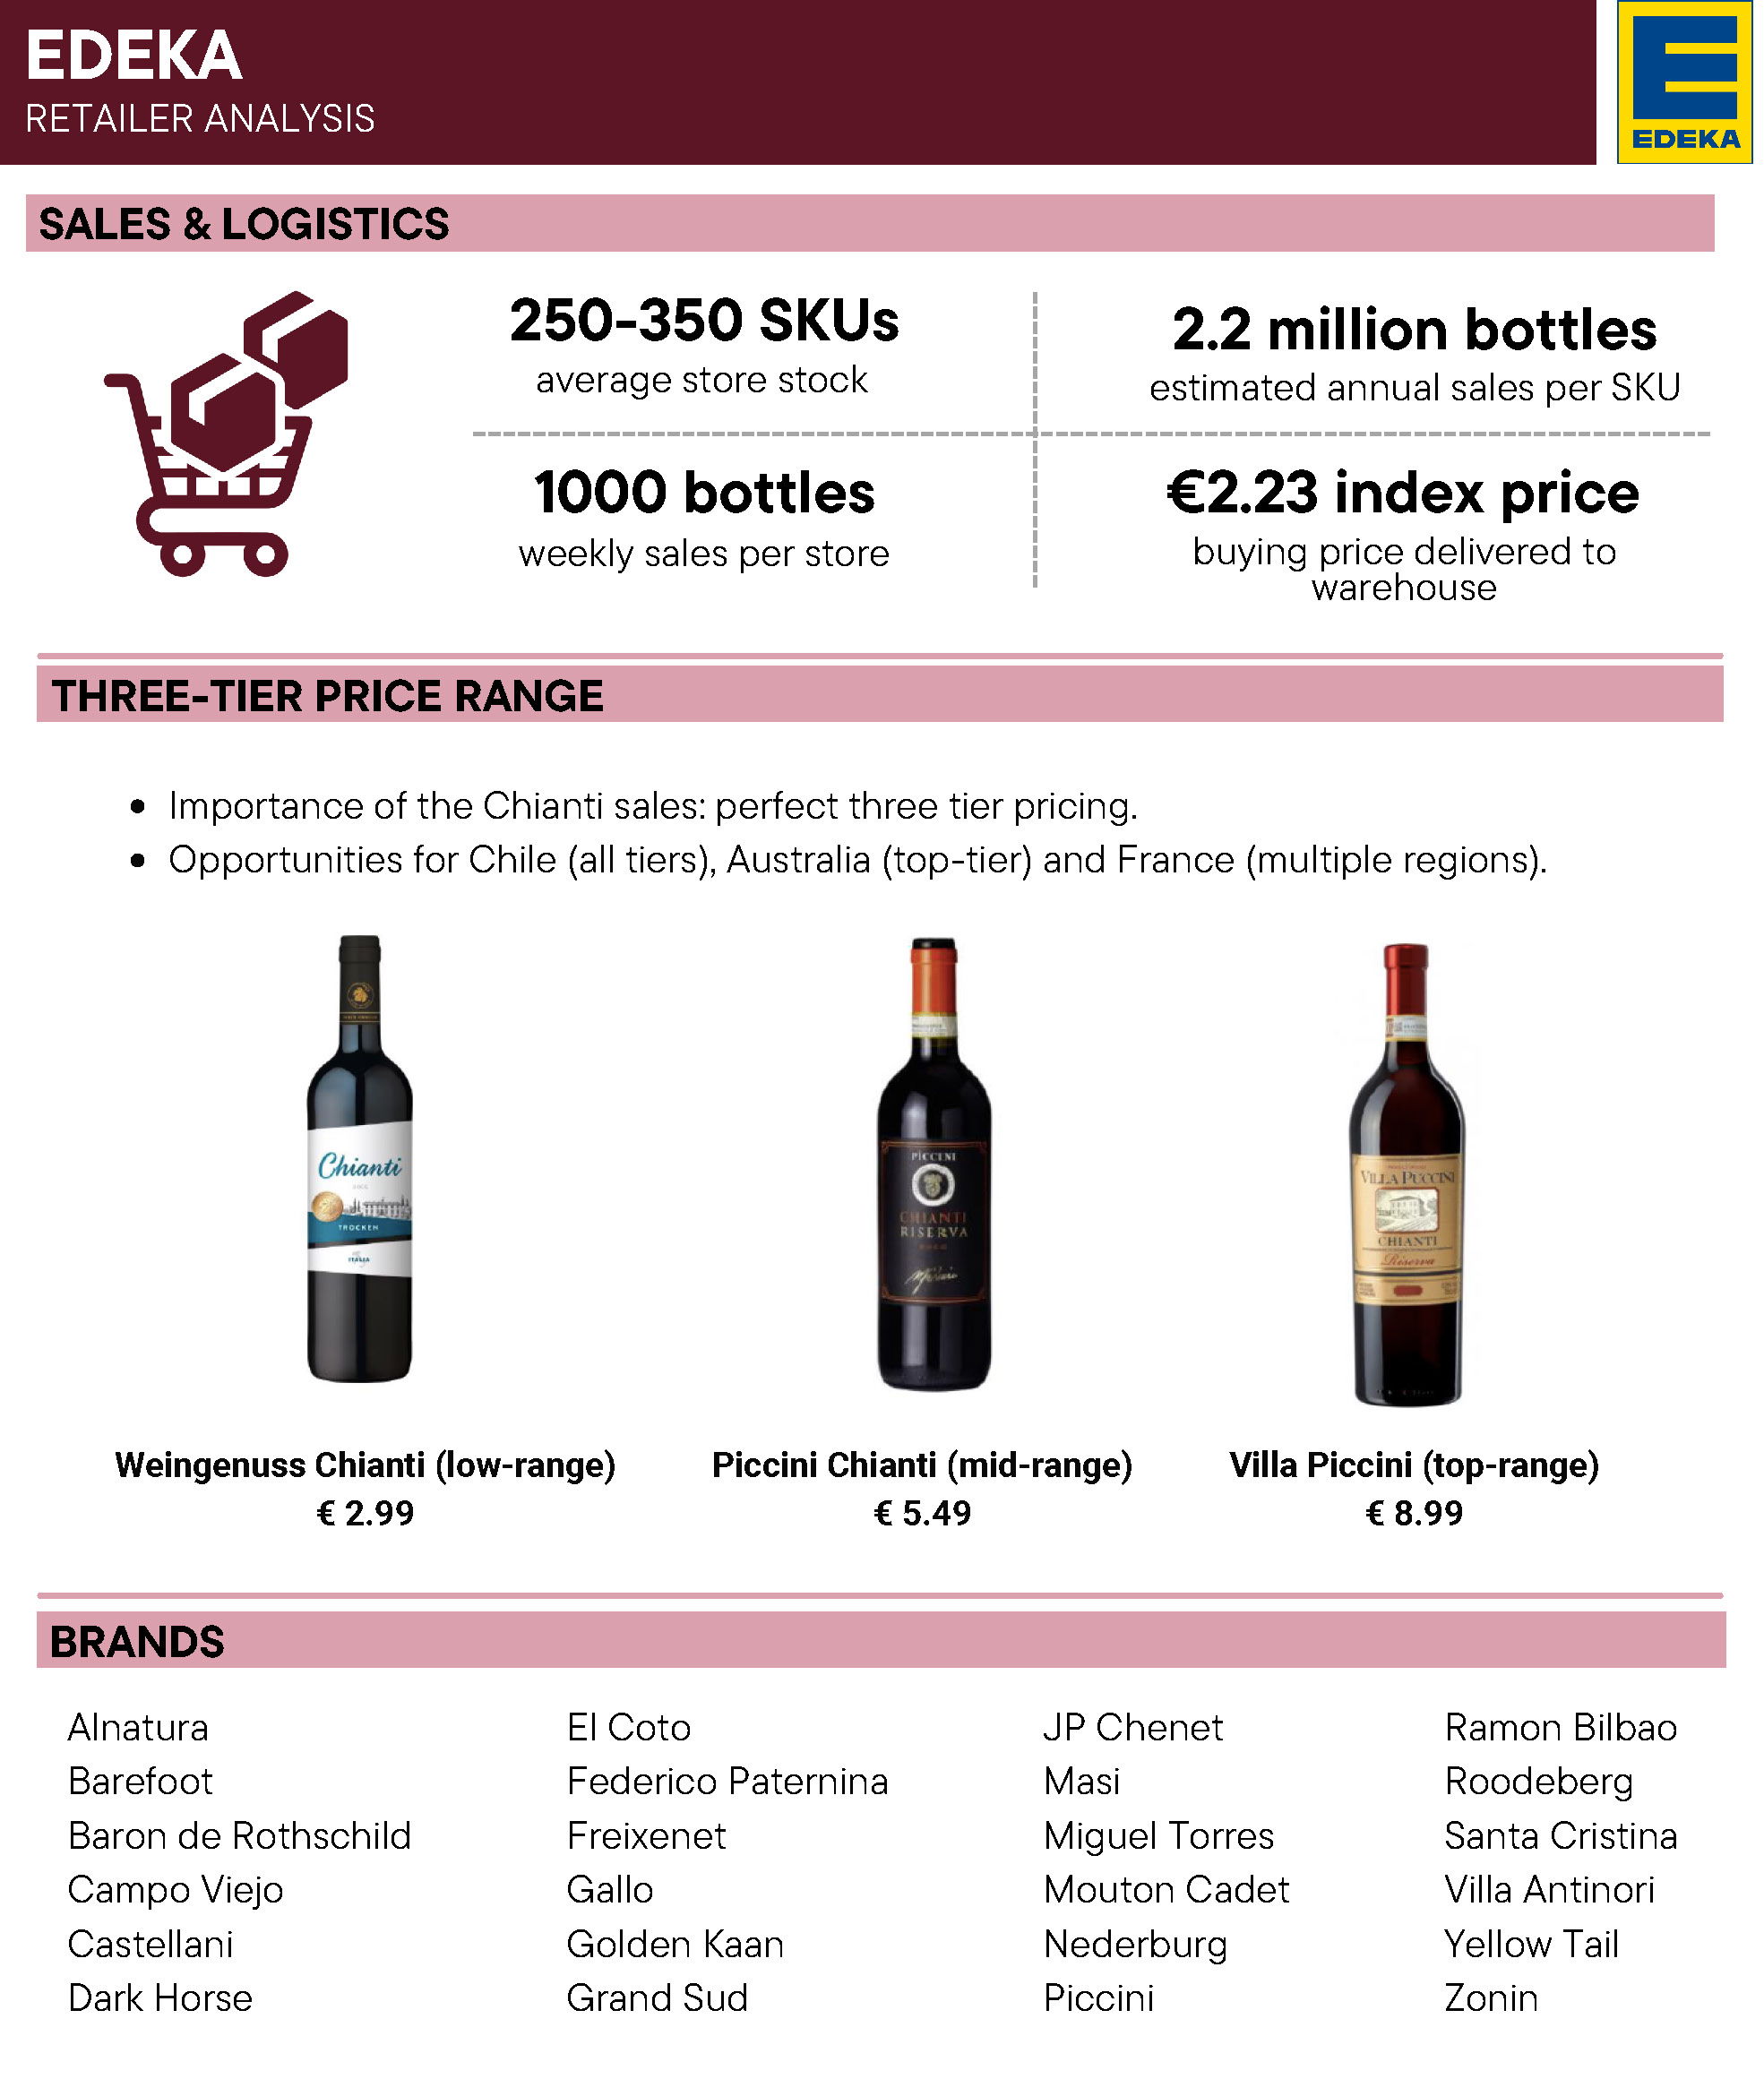
Wine Market Research - Germany Country Profile
